Australia's national VET data custodian

NCVER

Description


This publication presents information on the vocational education and training (VET) undertaken by school students as part of their senior secondary certificate of education (SSCE).

Students can engage in VET through a school-based apprenticeship or traineeship, or through alternative pathways (referred to as 'other VET in Schools students').

Highlights

test

Report


ADDITIONAL INFORMATION

Data are presented by the state or territory of the senior secondary assessment authority.

The estimated participation rate is calculated using state of data submitter as a proxy for state of residence due to the high number of records with an unknown residential address.

Data for calculating the participation rate are sourced from the NCVER National VET in Schools Collection, and Australian Bureau of Statistics (ABS) 2024, Schools, Table 42b Number of Full-time and Part-time Students, 2006-2024.


© Commonwealth of Australia, 2025

Creative Commons, attribution required

For details and exceptions visit the NCVER Portal.

This document should be attributed as NCVER 2025, VET in schools 2024, NCVER, Adelaide.

This work has been produced by NCVER on behalf of the Australian Government, and state and territory governments, with funding provided through the Australian Government Department of Employment and Workplace Relations.

The views and opinions expressed in this document are those of NCVER and do not necessarily reflect the views of the Australian Government or state and territory governments.

ISSN        2206-5156

TD/TNC  160.09

Published by NCVER, ABN 87 007 967 311

DataBuilder

The DataBuilder allows users to quickly create customised tables using the latest VET in Schools data, filter by a selection of variables and compare training activity over time. There are four separate datasets available: students, program enrolments, program completions and subject enrolments.

THIS PUBLICATION HAS BEEN SUPERSEDED.

For the most recent release please see the Apprentices and trainees collection page.

Description

This publication provides a snapshot of apprenticeship and traineeship contracts of training across Australia.

It presents statistics on contract commencements, recommencements, completions, cancellations and withdrawals as well as contracts currently in training up until 31 March 2025, derived from the latest National Apprentice and Trainee Collection.

Seasonal trends exist across the various apprentice and trainee contract statuses. The March quarter typically sees a higher number of commencements compared to other quarters, reflecting the intake of new apprentices and trainees at the beginning of the year.

Highlights

Apprentices and trainees in-training

As at 31 March 2025, there were 320,830 active (in-training) apprentice and trainee contracts nationally, with over two-thirds in trade occupations. The total number of in-training contracts decreased by 7.9% from 31 March 2024. Trade contracts decreased by 3.2%, to 230,145, while non-trade contracts declined by 17.9%, to 90,665.

Trade occupations

Compared with the March quarter 2024:

  • Commencements declined by 1.8% overall, but varied across trade occupations. Trade apprenticeship commencements have traditionally tracked closely with the unemployment rate, 4.1% in March 2025, illustrating their general responsiveness to economic conditions. The largest declines were among Construction Trades Workers (down 350, or by 4.2%, to 8,055), and Automotive and Engineering Trades Workers (down 300, or by 3.0%, to 9,770). These occupations accounted for 25.1% and 30.5% of all commencing trade contracts respectively. Commencements increased for Electrotechnology and Telecommunications Trades Workers (up 200, or by 2.6%, to 7,925), accounting for 24.7% of commencing trade contracts.
  • Completions increased by 11.6% overall, continuing a general upward trend since the March quarter 2023. The largest increases were among Construction Trade Workers (up 775, or by 19.9%, to 4,660), Automotive and Engineering Trades Workers (up 585, or by 16.7%, to 4,085), and Electrotechnology and Telecommunications Trades Workers (up 480, or by 18.7%, to 3,030). These occupations accounted for 31.1%, 27.2% and 20.2% of completed trade contracts respectively.
  • Cancellations and withdrawals declined by 5.1% overall. The largest decrease was in Constructions Trade Workers (down 365, or by 7.7%, to 4,345). This occupation accounted for 30.8% of all cancelled or withdrawn trade contracts.

Non-Trade occupations

Compared with the March quarter 2024:

  • Commencements decreased  by 14.1% overall, continuing a general downward trend since the March quarter 2022. The largest decreases were among Sales Workers (down 1,095, or 44.6%, to 1,360), Clerical and Administrative Workers (down 895, or by 20.4%, to 3,500), and Community and Personal Service Workers (down 740, or by 7.9% to 8,635). These occupations accounted for 6.8%, 17.6% and 43.4% of commencing non-trade contracts respectively.
  • Completions decreased in most occupations and by 11.1% overall. The largest declines were among Clerical and Administrative Workers (down 870, or by 30.1%, to 2,020), accounting for 19.9% of completed non-trade contracts. Contract completions increased among Community and Personal Service Workers (up 400, or by 10.7%, to 4,140), accounting for 40.7% of completed non-trade contracts.
  • Cancellations and withdrawals decreased across all occupations and by 23.1% overall. This follows a downward trend since the March quarter 2023. The largest decreases were among Clerical and Administrative Workers (down 1,260, or by 47.4%, to 1,395) and Community and Personal Service Workers (down 595, or by 11.9%, to 4,405). These occupations accounted for 15.2% and 47.9% of all cancelled or withdrawn non-trade contracts respectively.

Figure 1   Stock of trade and non-trade contracts of training, March quarter 2024-25

A green coloured flow diagram which shows the change of stock for trade contracts between March 2024 and March 2025In-training1RecommencementsCommencementsCancellations/withdrawalsCompletions32,0901.8%14,1055.1%15,00011.6%230,1453.2%6,5657.9%Trade A purple flow diagram which shows the change of stock for non-trade contracts between March 2024 and March 2025 In-training1RecommencementsCommencementsCancellations/withdrawalsCompletions19,88514.1%10,16511.1%90,66517.9%1,45011.0%9,19023.1%Non-trade

1 In-training is comprised of active contracts, i.e., the number of contracts that have commenced, recommenced or suspended, and where contracts have not yet been completed, cancelled/withdrawn or expired.


Report

ADDITIONAL INFORMATION

  1. Unless stated otherwise, data are derived from the latest National Apprentice and Trainee Collection (no. 124, June 2025 estimates), using data up until 31 March 2025, which is compiled under the Australian Vocational Education and Training Management Information Statistical Standard (AVETMISS) for Apprentice and Trainee Collection Specifications, Release 7.0, October 2015.
  2. Due to the delay in time between an event (commencement, completion, etc.) occurring and the reporting of that event to NCVER, NCVER estimates the most recent figures. The estimation method involves weighting recently processed numbers based on average reporting lags. As estimates are revised for up to seven quarters, figures for the last two years may differ from those published in earlier or subsequent reports. The final counts are those submitted by jurisdictions. Further details on the methodology can be found in the Estimation of apprentice and trainee statistics technical paper.
  3. The COVID-19 pandemic in Australia brought about significant uncertainty for individuals, businesses, and governments. The resulting suspension of normal economic activities, combined with various government and economic interventions, has impacted apprentice and trainee numbers. Therefore, caution should be exercised when interpreting and comparing data from 2020 onwards.
  4. In-training figures represent the number of apprenticeship and traineeship training contracts where the apprentice or trainee is actively training under the terms of their contract, and who have not completed, cancelled or withdrawn from their training, or had their training contract expired. The figure reflects the number of active contracts at a given point in time (at the end of the quarter), and therefore in-training figures cannot be cumulated over time. For this reason, quarterly comparisons are equivalent to 12-months ending comparisons, as they both represent the changes as at 31 March from one year to the next.
  5. Note that the percentages presented in this product are reported to one decimal place. All other numbers, after aggregation, have been rounded to the nearest five. Rounding can lead to instances where the numbers in the body of a given table might not add to the rounded totals.
  6. Unknown data have not been reported in any tables, whereas the total includes all contracts, including those with unknown status. Hence, some figures in the tables may not sum to the total.
  7. Whilst the report is limited to data on contract commencements, in-training, completions and cancellations/withdrawals, data on contract recommencements, expiries and suspensions are available in VOCSTATS.
  8. As the vocations approved to be under an apprenticeship or traineeship training contract are not consistent across all jurisdictions, NCVER has adopted a Trade/Non-trade categorisation for the purpose of the National Apprentices and Trainees Collection with 'Trades' classified as all occupations listed under ANZSCO major group '3-Technicians and Trades workers' and 'Non-trades' classified as all other major occupations groups 1-2 and 4-8 (Occupations are classified using the ANZSCO - Australian and New Zealand Standard Classification of Occupations, 2022 Australian Update).

This infographic is drawn from Australian vocational education and training statistics: apprentices and trainees 2025 — March quarter, NCVER, Adelaide.

SOURCE: National Centre for Vocational Education Research (NCVER), National Apprentice and Trainee collection no. 124, June 2025 estimates, Australian Bureau of Statistics. (2025, June). Labour Force, Australia, Detailed. cat. no. 6291.0.55.001, see https://www.abs.gov.au/statistics/labour/employment-and-unemployment/labour-force-australia-detailed/latest-release.

© Commonwealth of Australia, 2025

For details and exceptions visit the NCVER Portal.

This work has been produced by NCVER on behalf of the Australian Government, and state and territory governments, with funding provided through the Australian Government Department of Employment and Workplace Relations.

The views and opinions expressed in this document are those of NCVER and do not necessarily reflect the views of the Australian Government or state and territory governments.

ISSN  1440-0359

Published by NCVER, ABN 87 007 967 311

10 year time series

The timeseries chart allows users to interact with apprentice and trainee data over a 10-year period and helps to visually interpret trends evident across various contract statuses.

DataBuilder

To access the most recently released DataBuilder for Apprentices and trainees quarterly, please see the Apprentices and trainees collection page.

The DataBuilder tool allows users to quickly create customised tables using the latest Apprentice and trainee data, filter by a selection of variables and compare training activity over time. Users can view quarterly, year-to-date and rolling 12-month data for commencements, recommencements, completions, cancellations/withdrawals and in-training.

THIS PUBLICATION HAS BEEN SUPERSEDED.

For the most recent release please see the Total VET students and courses collection page.

Description

This publication provides data and insights into all nationally recognised vocational education and training (VET) delivered in 2024 by Australian registered training providers (RTOs).

Snapshot


Report

© Commonwealth of Australia, 2025

Creative Commons, attribution required

For details and exceptions visit the NCVER Portal.

This document should be attributed as NCVER 2025, Total VET students and courses 2024, NCVER, Adelaide.

This work has been produced by NCVER on behalf of the Australian Government, and state and territory governments, with funding provided through the Australian Government Department of Employment and Workplace Relations.

The views and opinions expressed in this document are those of NCVER and do not necessarily reflect the views of the Australian Government or state and territory governments.

ISSN        2206-5156

TD/TNC  160.06

Published by NCVER, ABN 87 007 967 311

DataBuilder

To access the most recently released DataBuilder for Total VET students and courses please see the Total VET student and courses collection page.

This DataBuilder provides extensive data on students and full year training equivalents, program and subject enrolments, and program completions delivered by Australian training providers 2019-2024. Users can build their own tables, make selections and export their results.

Description

This publication provides a summary of data relating to Australia’s government-funded vocational education and training (VET) system.

Government funded VET is defined as all Commonwealth and state or territory government-funded training delivered by technical and further education (TAFE) institutes, other government providers (such as universities), private providers and community education providers.

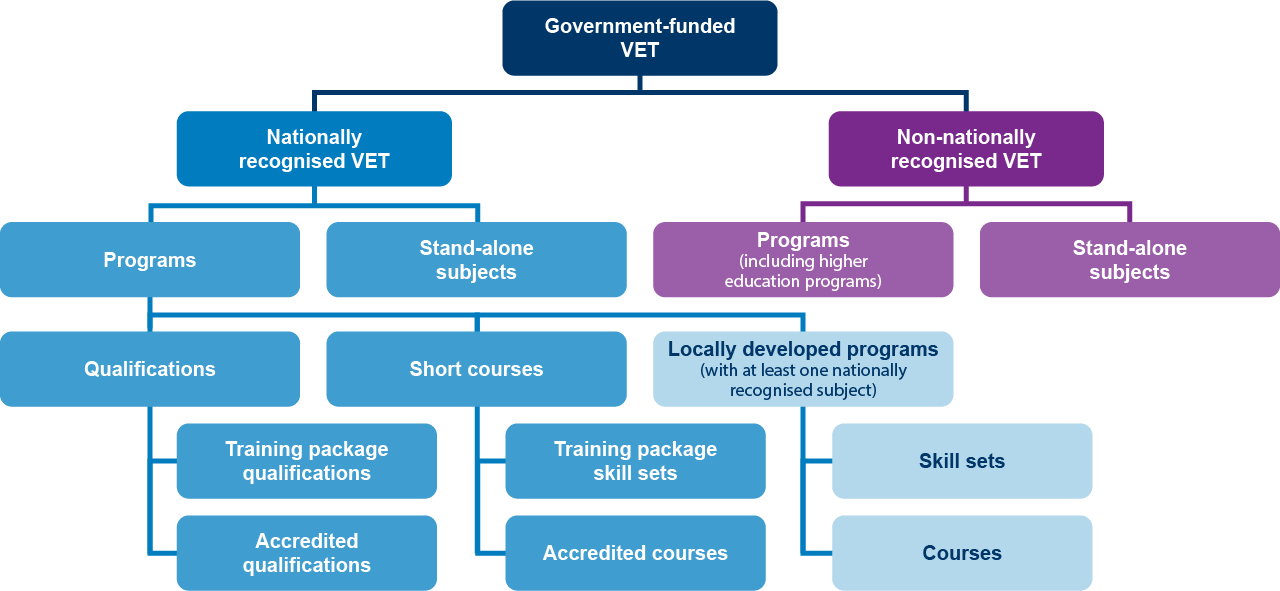
Figure 1 Government-funded training accreditation and type of training.

GF

Note: This publication does not present data on Fee-Free TAFE¹.

Highlights

Report


ADDITIONAL INFORMATION

1. For information on Fee-Free TAFE please see Fee-Free TAFE - Department of Employment and Workplace Relations, Australian Government.

2. Participation rates are derived by calculating the number of VET students with a usual residential address in an Australian state or territory, other Australian territories, or dependencies and where the state/territory is ‘Not known’ (excludes offshore population), as a percentage of the estimated Australian residential population in the corresponding age groups. Usual residential address refers to where the student usually resides rather than a temporary address a student relocates to go for training, work, or other purposes.

Sources: NCVER, National VET Provider 2024; Australian Bureau of Statistics, National, State and Territory population, (April) Quarterly Population Estimates by State/Territory, Sex and Age, Extracted April 2025.

3. Caution should be used when comparing trends, as 2024 NSW figures are likely overstated. For further details, see the explanatory notes (327.8 KB PDF).

© Commonwealth of Australia, 2025

Creative Commons, attribution required

For details and exceptions visit the NCVER Portal.

This document should be attributed as NCVER 2025, Government-funded students and courses 2024, NCVER, Adelaide.

This work has been produced by NCVER on behalf of the Australian Government, and state and territory governments, with funding provided through the Australian Government Department of Employment and Workplace Relations.

The views and opinions expressed in this document are those of NCVER and do not necessarily reflect the views of the Australian Government or state and territory governments.

ISSN  2205-4391  
TD/TNC  160.03  

Published by NCVER, ABN 87 007 967 311

DataBuilder

The DataBuilder allows users to quickly create customised tables using the latest Government-funded students and courses data, filter by a selection of variables and compare training activity over time. There are four separate datasets available: students, program enrolments, program completions and subject enrolments.

Description

This publication provides a snapshot of apprenticeship and traineeship contracts of training across Australia.

It presents statistics on contract commencements, recommencements, completions, cancellations and withdrawals as well as contracts currently in training up until 31 December 2024, derived from the latest National Apprentice and Trainee Collection.

Seasonal trends exist across the various apprentice and trainee contract statuses. The December quarter is usually marked by a higher number of completions, as many contracts conclude towards the end of the year.

Highlights

Apprentices and trainees in-training

As at 31 December 2024, there were 311 760 active (in-training) apprentice and trainee contracts nationally, with over two-thirds in trade occupations. The total number of in-training contracts decreased by 8.3% compared with 31 December 2023. Trade contracts decreased by 2.9%, to 220 920, while non-trade contracts declined by 19.1%, to 90 825.

Trade occupations

Compared with the December quarter 2023:

  • commencements decreased by 13.9% overall. The largest decreases were among Automotive and Engineering Trades Workers, (down 740, or by 17.1%, to 3565) and Construction Trade Workers, (down 690, or by 16.0%, to 3615). These occupations accounted for 25.5% and 25.8% of all commencing trade contracts respectively.
  • completions increased by 8.4% overall. The largest increases were among Construction Trade Workers, (up 875, or by 23.9%, to 4540) and Electrotechnology and Telecommunications Trades Workers, (up 710, or by 24.2%, to 3655). These occupations accounted for 28.9% and 23.3% of all completed trade contracts respectively.
  • cancellations and withdrawals declined by 7.8% overall. The largest decrease was in Constructions Trade Workers, (down 405, or by 8.6%, to 4300). This occupation accounted for 31.7% of all completed trade contracts.

Non-Trade occupations

Compared with the December quarter 2023:

  • commencements decreased by 18.7% overall. The largest decreases were among Clerical and Administrative Workers, (down 1000, or by 32.9%, to 2040), Community and Personal Service Workers, (down 880, or by 12.0% to 6475) and Sales Workers, (down 780, or 45.7%, to 925). These occupations accounted for 14.8%, 47.0% and 6.7% of commencing non-trade contracts respectively.
  • completions decreased by 12.3% overall. The largest decreases were among Clerical and Administrative Workers, (down 1095, or by 29.8%, to 2570) and Sales Workers, (down 420, or by 24.0%, to 1325). These occupations accounted for 18.4% and 9.5% of completed non-trade contracts respectively.
  • cancellations and withdrawals decreased by 25.0% overall. The largest decrease was among Clerical and Administrative Workers, (down 1165, or by 41.6%, to 1635) and Community and Personal Service Workers, (down 870, or by 16.6%, to 4355). These occupations accounted for 17.8% and 47.3% of all cancelled or withdrawn non-trade contracts respectively.

Figure 1   Stock of trade and non-trade contracts of training, December quarter 2024-23

A green flow diagram which shows the change of stock for trade contracts between September 2023 and September 2024 In-training1RecommencementsCommencementsCancellations/withdrawalsCompletions 13 990 13.9% 13 560 7.8% 15 695 8.4% 220 920 2.9%381019.6%Trade A purple flow diagram which shows the change of stock for non-trade contracts between September 2023 and September 2024 In-training1RecommencementsCommencementsCancellations/withdrawalsCompletions 13 770 18.7% 13 930 12.3% 90 825 19.1%108521.5% 9205 25.0%Non-trade

1 In-training is comprised of active contracts, i.e., the number of contracts that have commenced, recommenced or suspended, and where contracts have not yet been completed, cancelled/withdrawn or expired.


Report

ADDITIONAL INFORMATION

  1. Unless stated otherwise, data are derived from the latest National Apprentice and Trainee Collection (no. 123, March 2025 estimates), using data up until 31 December 2024, which is compiled under the Australian Vocational Education and Training Management Information Statistical Standard (AVETMISS) for Apprentice and Trainee Collection Specifications, Release 7.0, October 2015.
  2. Due to the delay in time between an event (commencement, completion, etc.) occurring and the reporting of that event to NCVER, NCVER estimates the most recent figures. The estimation method involves weighting recently processed numbers based on average reporting lags. As estimates are revised for up to seven quarters, figures for the last two years may differ from those published in earlier or subsequent reports. The final counts are those submitted by jurisdictions. Further details on the methodology can be found in the Estimation of apprentice and trainee statistics technical paper.
  3. The COVID-19 pandemic in Australia brought about significant uncertainty for individuals, businesses, and governments. The resulting suspension of normal economic activities, combined with various government and economic interventions, has impacted apprentice and trainee numbers. Therefore, caution should be exercised when interpreting and comparing data from 2020 onwards.
  4. In-training figures represent the number of apprenticeship and traineeship training contracts where the apprentice or trainee is actively training under the terms of their contract, and who have not completed, cancelled or withdrawn from their training, or had their training contract expired. The figure reflects the number of active contracts at a given point in time (at the end of the quarter), and therefore in-training figures cannot be cumulated over time. For this reason, quarterly comparisons are equivalent to 12-months ending comparisons, as they both represent the changes as at 31 December from one year to the next.
  5. Note that the percentages presented in this product are reported to one decimal place. All other numbers, after aggregation, have been rounded to the nearest five. Rounding can lead to instances where the numbers in the body of a given table might not add to the rounded totals.
  6. Unknown data have not been reported in any tables, whereas the total includes all contracts, including those with unknown status. Hence, some figures in the tables may not sum to the total.
  7. Whilst the report is limited to data on contract commencements, in-training, completions and cancellations/withdrawals, data on contract recommencements, expiries and suspensions are available in VOCSTATS.
  8. As the vocations approved to be under an apprenticeship or traineeship training contract are not consistent across all jurisdictions, NCVER has adopted a Trade/Non-trade categorisation for the purpose of the National Apprentices and Trainees Collection with 'Trades' classified as all occupations listed under ANZSCO major group '3-Technicians and Trades workers' and 'Non-trades' classified as all other major occupations groups 1-2 and 4-8 (Occupations are classified using the ANZSCO - Australian and New Zealand Standard Classification of Occupations, 2022 Australian Update).

This infographic is drawn from Australian vocational education and training statistics: apprentices and trainees 2024 — December quarter, NCVER, Adelaide.

SOURCE: National Centre for Vocational Education Research (NCVER), National Apprentice and Trainee collection no. 123, March 2025 estimates, Australian Bureau of Statistics. (2025, February). Labour Force, Australia, Detailed. cat. no. 6291.0.55.001, see https://www.abs.gov.au/statistics/labour/employment-and-unemployment/labour-force-australia-detailed/latest-release.

10 year time series

The timeseries chart allows users to interact with apprentice and trainee data over a 10 year period and helps to visually interpret trends evident across various contract statuses.

DataBuilder

The DataBuilder tool allows users to quickly create customised tables using the latest Apprentice and Trainee data, filter by a selection of variables and compare training activity over time. Users can view quarterly, year-to-date and rolling 12-month data for commencements, recommencements, completions, cancellations/withdrawals and in-training.

© Commonwealth of Australia, 2025

For details and exceptions visit the NCVER Portal.

This work has been produced by NCVER on behalf of the Australian Government, and state and territory governments, with funding provided through the Australian Government Department of Employment and Workplace Relations.

The views and opinions expressed in this document are those of NCVER and do not necessarily reflect the views of the Australian Government or state and territory governments.

ISSN  1440-0359

Published by NCVER, ABN 87 007 967 311

THIS PUBLICATION HAS BEEN SUPERSEDED.

For the most recent release please see the Apprentices and trainees collection page.

Product improvements

We’ve added a new feature! You can now use the print selection button to print or save the report filtered by state/territory, contract status, and reporting period.

Description

This publication provides a snapshot of apprenticeship and traineeship contracts of training across Australia. It presents statistics on contract commencements, completions, cancellations and withdrawals as well as contracts currently in training up until 30 September 2024, derived from the latest National Apprentice and Trainee Collection, collection no. 122, December 2024 estimates.

Seasonal trends exist across the various apprentice and trainee contract statuses. The March quarter typically sees a higher number of commencements compared with other quarters, reflecting the intake of new apprentices and trainees at the beginning of the year. In contrast, the December quarter is usually marked by a higher number of completions, as many contracts conclude towards the end of the year.

Highlights

Apprentices and trainees in-training

As at 30 September 2024, there were 333 765 active (in-training) apprentice and trainee contracts nationally, with over two-thirds in trade occupations. The total number of in-training contracts decreased by 7.8% compared with 30 September 2023. Trade contracts decreased by 1.9%, to 232 610, while non-trade contracts declined by 18.9%, to 101 120.

Trade occupations

Compared with the September quarter 2023:

  • commencements decreased by 17.4% overall. The largest decreases were among Construction Trade Workers, down 865 (or 18.6%) to 3785 and Automotive and Engineering Trades Workers, down 775 or (or 18.0%) to 3545. These occupations accounted for 27.3% and 25.6% of all commencing trade contracts respectively
  • completions increased by 7.1% overall. The largest increases were among Automotive and Engineering Trades Workers, up 485 (or 19.8%) to 2930 and Construction Trades Workers, up 475 (or 18.6%) to 3010. These occupations accounted for 26.8% and 27.5% of all completed trade contracts respectively
  • cancellations and withdrawals declined by 1.9% overall. Despite the decline, there were increases among Automotive and Engineering Trades Workers, up 290 (or 8.6%) to 3665 and Electrotechnology and Telecommunications Trades Workers, up 285 (or 10%) to 3125. These occupations accounted for 24.3% and 20.7% of all cancelled or withdrawn trade contracts respectively.

Non-Trade occupations

Compared with the September quarter 2023:

  • commencements decreased by 24.7% overall. This was primarily due to a decrease in Community and Personal Service Workers, which declined by 1605 (or 19.3%) to 6715. This occupation accounted for 47.3% of commencing non-trade contracts
  • completions decreased by 14.7% overall. The largest decrease was among Clerical and Administrative Workers, which decreased by 1380 (or 39.3%) to 2135. This occupation accounted for 18.3% of all completed non-trade contracts. Community and Personal Service Workers accounted for the largest proportion of completed non-trade contracts (40.2%) and increased by 865 (or 22.6%) to 4690
  • cancellations and withdrawals decreased by 27.3% overall. The largest decrease was among Clerical and Administrative Workers, down by 1725 (or 47.2%) to 1935. This occupation accounted for 18.6% of all cancelled or withdrawn non-trade contracts.

Figure 1   Stock of trade and non-trade contracts of training, September quarter 2023-24

A green flow diagram which shows the change of stock for trade contracts between September 2023 and September 2024 In-training1RecommencementsCommencementsCancellations/withdrawalsCompletions 13 855 17.4% 15 065 1.9% 10 940 7.1% 232 610 1.9%562511.9%Trade A purple flow diagram which shows the change of stock for non-trade contracts between September 2023 and September 2024 In-training1RecommencementsCommencementsCancellations/withdrawalsCompletions 14 205 24.7% 11 655 14.7% 101 120 18.9%151517.4% 10 385 27.3%Non-trade

1 In-training is comprised of active contracts, i.e., the number of contracts that have commenced, recommenced or suspended, and where contracts have not yet been completed, cancelled/withdrawn or expired.


Report

ADDITIONAL INFORMATION

  1. Unless stated otherwise, data are derived from the latest National Apprentice and Trainee Collection (no. 122, December 2024 estimates), which is compiled under the Australian Vocational Education and Training Management Information Statistical Standard (AVETMISS) for Apprentice and Trainee Collection Specifications, Release 7.0, October 2015.
  2. Due to the delay in time between an event (commencement, completion, etc.) occurring and the reporting of that event to NCVER, NCVER estimates the most recent figures. The estimation method involves weighting recently processed numbers based on average reporting lags. As estimates are revised for up to seven quarters, figures for the last two years may differ from those published in earlier or subsequent reports. The final counts are those submitted by jurisdictions. Further details on the methodology can be found in the Estimation of apprentice and trainee statistics technical paper.
  3. The COVID-19 pandemic in Australia brought about significant uncertainty for individuals, businesses, and governments. The resulting suspension of normal economic activities, combined with various government and economic interventions, has impacted apprentice and trainee numbers. Therefore, caution should be exercised when interpreting and comparing data from 2020 onwards.
  4. In-training figures represent the number of apprenticeship and traineeship training contracts where the apprentice or trainee is actively training under the terms of their contract, and who have not completed, cancelled or withdrawn from their training, or had their training contract expired. The figure reflects the number of active contracts at a given point in time (at the end of the quarter), and therefore in-training figures cannot be cumulated over time. For this reason, quarterly comparisons are equivalent to 12-months ending comparisons, as they both represent the changes as at 30 September from one year to the next.
  5. Note that the percentages presented in this product are reported to one decimal place. All other numbers, after aggregation, have been rounded to the nearest five. Rounding can lead to instances where the numbers in the body of a given table might not add to the rounded totals.
  6. Unknown data have not been reported in any tables, whereas the total includes all contracts, including those with unknown status. Hence, some figures in the tables may not sum to the total.
  7. Whilst the report is limited to data on contract commencements, in-training, completions and cancellations/withdrawals, data on contract recommencements, expiries and suspensions are available in VOCSTATS.
  8. As the vocations approved to be under an apprenticeship or traineeship training contract are not consistent across all jurisdictions, NCVER has adopted a Trade/Non-trade categorisation for the purpose of the National Apprentices and Trainees Collection with 'Trades' classified as all occupations listed under ANZSCO major group '3-Technicians and Trades workers' and 'Non-trades' classified as all other major occupations groups 1-2 and 4-8 (Occupations are classified using the ANZSCO - Australian and New Zealand Standard Classification of Occupations, 2022 Australian Update).

This infographic is drawn from Australian vocational education and training statistics: apprentices and trainees 2024 — September quarter, NCVER, Adelaide.

SOURCE: National Centre for Vocational Education Research (NCVER), National Apprentice and Trainee collection no. 122, December 2024 estimates, Australian Bureau of Statistics. (2024, December). Labour Force, Australia, Detailed. cat. no. 6291.0.55.001, see https://www.abs.gov.au/statistics/labour/employment-and-unemployment/labour-force-australia-detailed/latest-release.

© Commonwealth of Australia, 2025

For details and exceptions visit the NCVER Portal.

This work has been produced by NCVER on behalf of the Australian Government, and state and territory governments, with funding provided through the Australian Government Department of Employment and Workplace Relations.

The views and opinions expressed in this document are those of NCVER and do not necessarily reflect the views of the Australian Government or state and territory governments.

ISSN  1440-0359

Published by NCVER, ABN 87 007 967 311

10 year time series

A 10-year timeseries of commencements, completions, cancellations and withdrawals, with choices for the user to select states/territories, contract statuses and trade status.

DataBuilder

To access the most  recently released DataBuilder for Apprentices and trainees quarterly please see the Apprentices and trainees collection page.

The DataBuilder tool allows users to quickly create customised tables using the latest Apprentice and Trainee data, filter by a selection of variables and compare training activity over time. Users can view quarterly, year-to-date and rolling 12-month data for contract commencements, completions, cancellations/withdrawals and in-training.

THIS PUBLICATION HAS BEEN SUPERSEDED.

For the most recent release please see the Apprentice and trainee outcomes collection page.

Description

This product provides a summary of the outcomes of apprentices and trainees who undertook an apprenticeship or traineeship during 2023. It includes those who completed their training (completers) and those who cancelled or withdrew (non-completers). The figures are derived from the National Student Outcomes Survey. The 2024 survey results are based on the responses of 20 877 apprentices and trainees, collected between June and August 2024.

Highlights

Report


DataBuilder

To access the most recently released DataBuilder for Apprentice and trainee outcomes please see the Apprentice and trainee outcomes collection page.

The DataBuilder provides extensive data on apprentice’s and trainees’ reasons for training, reasons for non-completion, their employment outcomes, further study outcomes and satisfaction with the apprenticeship or traineeship. Users can filter by a selection of variables, view the margins of error (to determine the amount of certainty/error in survey estimates), and export their results.

Data dictionary

The National Student Outcomes Survey 2024 - apprentice and trainee component: data dictionary has been superseded. The online data dictionary presents the information in a clear, structured and responsive user interface and includes a search function and print options to help you find and export information. This data dictionary presents information across three different views to suit the needs of various users and replaces the previous pdf version. To access the most recent National Student Outcomes Survey - apprentice and trainee component: data dictionary please see the Apprentice and trainee outcomes collection page.

Product improvements

  • Updated "Highlights" section to include selected cohort information and additional student information on government-funded nationally recognised qualifications.
  • Full-year training equivalents (FYTEs) have been removed from the report. Data on FYTEs will continue to be available in the subject enrolments DataBuilder and VOCSTATS cube.

Description

This publication provides a summary of data relating to students, programs, subjects, and training providers in Australia’s government-funded vocational education and training (VET) system. Government-funded is defined as Commonwealth and/or state or territory government-funded training delivered by contracted training organisations.

Data for the Government-funded students and courses series are received by NCVER in four cumulative submissions:

  • January to March, submitted in May
  • January to June, submitted in August
  • January to September, submitted in November
  • January to December, submitted in March.


This allows additional data to be reported and corrections made to previously submitted data.

The data in this publication cover the period of 1 January to 30 September 2024. For comparative purposes it examines data for the same period of the previous year.

Highlights

Report


© Commonwealth of Australia, 2025

Creative Commons, attribution required

For details and exceptions visit the NCVER Portal.

This document should be attributed as NCVER 2025, Government-funded students and courses - January to September 2024, NCVER, Adelaide.

This work has been produced by NCVER on behalf of the Australian Government, and state and territory governments, with funding provided through the Australian Government Department of Employment and Workplace Relations.

The views and opinions expressed in this document are those of NCVER and do not necessarily reflect the views of the Australian Government or state and territory governments.

ISSN        2205-4391

TD/TNC  158.03

Published by NCVER, ABN 87 007 967 311

DataBuilder

The DataBuilder provides an interactive way of visualising data that can be customised as needed which can show students, program enrolments, and subject enrolments in Australia's government-funded vocational education and training (VET) system.

THIS PUBLICATION HAS BEEN SUPERSEDED.

For the most recent release please see the Apprentices and trainees collection page.

Description

This publication provides a snapshot of apprenticeship and traineeship contracts of training across Australia. It presents statistics on contract commencements, completions, cancellations and withdrawals as well as contracts currently in training up until 30 June 2024, derived from the latest National Apprentice and Trainee Collection, collection no. 121, September 2024 estimates.

Seasonal trends exist across the various apprentice and trainee contract statuses. The March quarter typically sees a higher number of commencements compared with other quarters, reflecting the intake of new apprentices and trainees at the beginning of the year. In contrast, the December quarter is usually marked by a higher number of completions, as many contracts conclude towards the end of the year.


Report

ADDITIONAL INFORMATION

  1. Unless stated otherwise, data are derived from the latest National Apprentice and Trainee Collection (no. 121, September 2024 estimates), which is compiled under the Australian Vocational Education and Training Management Information Statistical Standard (AVETMISS) for Apprentice and Trainee Collection Specifications, Release 7.0, October 2015.
  2. Due to the delay in time between an event (commencement, completion, etc.) occurring and the reporting of that event to NCVER, NCVER estimates the most recent figures. The estimation method involves weighting recently processed numbers based on average reporting lags. As estimates are revised for up to seven quarters, figures for the last two years may differ from those published in earlier or subsequent reports. The final counts are those submitted by jurisdictions. Further details on the methodology can be found in the Estimation of apprentice and trainee statistics technical paper.
  3. The COVID-19 pandemic in Australia brought about significant uncertainty for individuals, businesses, and governments. The resulting suspension of normal economic activities, combined with various government and economic interventions, has impacted apprentice and trainee numbers. Therefore, caution should be exercised when interpreting and comparing data from 2020 onwards.
  4. In-training figures represent the number of apprenticeship and traineeship training contracts where the apprentice or trainee is actively training under the terms of their contract, and who have not completed, cancelled or withdrawn from their training, or had their training contract expired. The figure reflects the number of active contracts at a given point in time (at the end of the quarter), and therefore in-training figures cannot be cumulated over time. For this reason, quarterly comparisons are equivalent to 12-months ending comparisons, as they both represent the changes as at 30 June from one year to the next.
  5. Note that the percentages presented in this product are reported to one decimal place. All other numbers, after aggregation, have been rounded to the nearest five. Rounding can lead to instances where the numbers in the body of a given table might not add to the rounded totals.
  6. Unknown data have not been reported in any tables, whereas the total includes all contracts, including those with unknown status. Hence, some figures in the tables may not sum to the total.
  7. Whilst the report is limited to data on contract commencements, in-training, completions and cancellations/withdrawals, data on contract recommencements, expiries and suspensions are available in VOCSTATS.
  8. As the vocations approved to be under an apprenticeship or traineeship training contract are not consistent across all jurisdictions, NCVER has adopted a Trade/Non-trade categorisation for the purpose of the National Apprentices and Trainees Collection with 'Trades' classified as all occupations listed under ANZSCO major group '3-Technicians and Trades workers' and 'Non-trades' classified as all other major occupations groups 1-2 and 4-8 (Occupations are classified using the ANZSCO - Australian and New Zealand Standard Classification of Occupations, 2022 Australian Update).

This infographic is drawn from Australian vocational education and training statistics: apprentices and trainees 2024 — June quarter, NCVER, Adelaide.

SOURCE: National Centre for Vocational Education Research (NCVER), National Apprentice and Trainee collection no. 121, September 2024 estimates, Australian Bureau of Statistics. (2024, September). Labour Force, Australia, Detailed. cat. no. 6291.0.55.001, see https://www.abs.gov.au/statistics/labour/employment-and-unemployment/labour-force-australia-detailed/latest-release.

© Commonwealth of Australia, 2024

For details and exceptions visit the NCVER Portal.

This work has been produced by NCVER on behalf of the Australian Government, and state and territory governments, with funding provided through the Australian Government Department of Employment and Workplace Relations.

The views and opinions expressed in this document are those of NCVER and do not necessarily reflect the views of the Australian Government or state and territory governments.

ISSN  1440-0359

Published by NCVER, ABN 87 007 967 311

10 year time series

A 10-year timeseries of commencements, completions, cancellations and withdrawals, with choices for the user to select states/territories, contract statuses and trade status.

DataBuilder

To access the most recently released DataBuilder for Apprentices and trainees quarterly, please see the Apprentices and trainees collection page.

The DataBuilder tool allows users to quickly create customised tables using the latest Apprentice and Trainee data, filter by a selection of variables and compare training activity over time. Users can view quarterly, year-to-date and rolling 12-month data for contract commencements, completions, cancellations/withdrawals and in-training.

THIS PUBLICATION HAS BEEN SUPERSEDED.

For the most recent release please see the VET student outcomes survey collection page.

Description

This publication provides a summary of the outcomes and satisfaction of students who undertook nationally recognised vocational education and training (VET) delivered by registered training organisations (RTOs) in Australia during 2023. The figures are derived from the National Student Outcomes Survey, which is an annual survey of students who undertook VET in Australia during the previous calendar year. The 2024 results are based on the responses of 243 778 VET students collected between June and August 2024.

Highlights

Report


DataBuilder

To access the most recently released DataBuilder for VET student outcomes and Government-funded student outcomes please see the VET student outcomes survey collection page.

The DataBuilder provides extensive data on students’ satisfaction with training, reasons for training, and their employment and further study outcomes. Users can filter by a selection of variables (including by state or territory), view the margins of error (to determine the amount of certainty/error in survey estimates) and export their results:

The figures in this product are derived from the National Student Outcomes Survey, which is an annual survey of students who completed their vocational education and training (VET) in Australia during the previous calendar year.

Data dictionary

To access the latest National Student Outcomes Survey online data dictionary please see the VET student outcomes survey collection page.

The National Student Outcomes Survey 2024: data dictionary is designed to assist users of unit record files (URFs) to understand the variables in the 2024 survey. Information is also included on the 2016 to 2023 surveys. This data dictionary is provided in an online format and includes a search function and print options to help you find and export information. The information is presented across three different views (data element name, variable name and topic) to suit the needs of various users.